The main purpose of Sprint Analytics is to equip you better to know Sprint progress. There are burndown and sprint velocity widgets to help you track the work.
1. Access Sprint Analytics
There are multiple ways to access Sprint Analytics page.
1.1 Quick Sprint Analytics
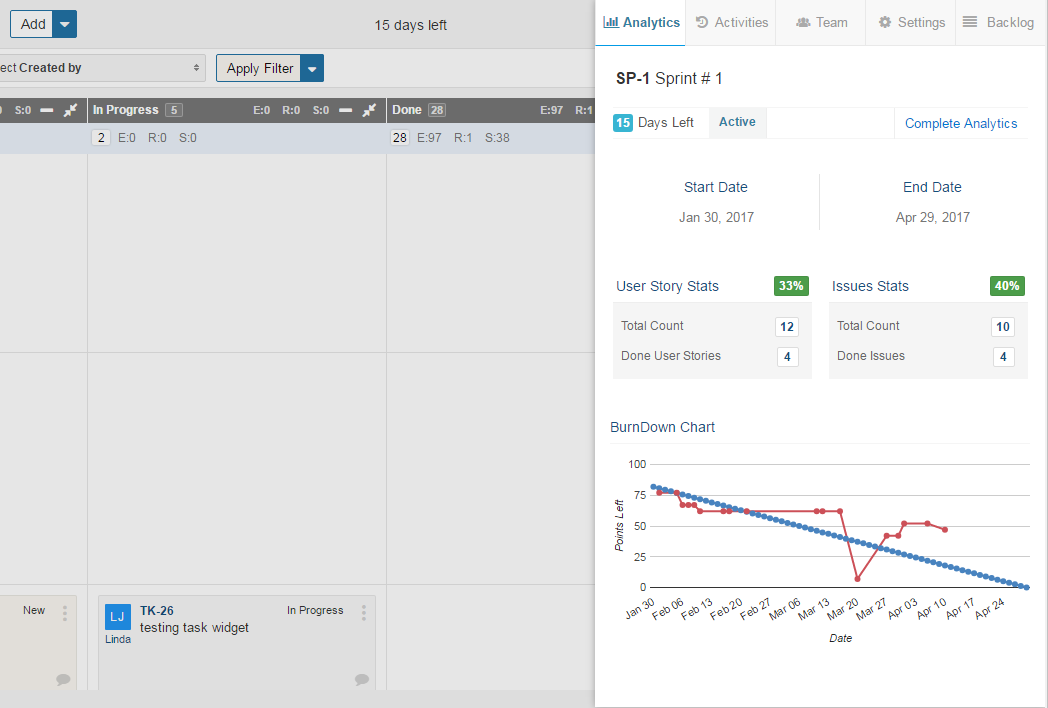
It can be accessed from Sprint Board and gives essential information of selected Sprint. It includes Days left in Sprint, Summary of User Story and Issues stats, and BurnDown chart. If you want to get more details, click on Complete Analytics provided on the same page. To access Quick Sprint analytics:
1.2 Detailed Sprint Analytics
Detailed Analytics includes Statistics Cards, Sprint Velocity, BurnUp, and BurnDown graphs. You can define Sprint Goal and Definition of Done here. Sprint Analytics can also be accessed by:
2. Sprint Analytics Overview
Handling a Sprint by yourself can be hectic and that’s why Yodiz makes sure that you have all the necessary tools for seamless work management. Sprint Analytics page provides you detailed reports of your Sprint. The best part is that you also get all statistics to conclude better that how to proceed to achieve your Sprint Goals.
Let’s get you acquainted with the Sprint Analytics.
2.1 Project and Sprint
The Complete Sprint Analytics shows you the Sprint you navigated from by default. If you want to view analytics of some other Sprint, just go to the top left side and choose your desired Project and Sprint from dropdown.
2.2 Statistics Cards
When dealing with large Sprints, it becomes almost impossible to keep track of work done and work left. Yodiz Analytics view can help you comprehend the Sprint Stats in one quick view. Let’s discuss each of them individually.
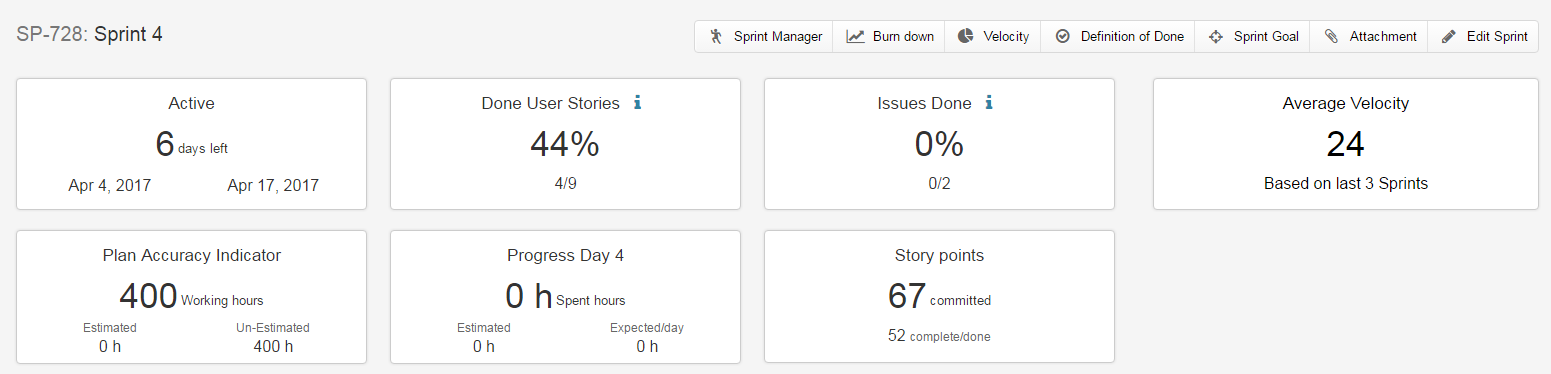
2.3 Active – Sprint Status
It is basically the current Status of your Sprint and the number indicates remaining days in Sprint completion, along with the start and end date of Sprint on each side.
2.4 Done User Stories
Percentage of User Stories done in a Sprint. At the bottom of this card, you can find the number of done User Stories out of total User Stories.
Note: If any User Story is completed after the Sprint date, a small notification will appear on this card informing that the current stats are for the work done after Sprint end date.
2.5 Issues Done
Percentage of Fixed Issues in a Sprint. At the bottom of this card, you can find the number of fixed Issues (belonging to done category) out of total Issues.
2.6 Average Velocity
The number shown on the Average Velocity card is based upon the speed of progression in last 3-10 Sprints of the Project depending upon the selection of Number of Sprints in Velocity Graph.
2.7 Plan Accuracy Indicator
It indicates the total hours your team has worked on the Sprint. At the bottom of this card, you can see the total hours that you have estimated for Items and the actual spent hours.
2.8 Progress Day
It shows the number of days passed since the Sprint started and the number of hours that have been spent on the Sprint. You can also see the total estimated hours and the number of hours that should be spent per day in order to achieve the Sprint goal.
2.9 Story Points
It shows the number of total story points committed for the Sprint in User Stories as well as the completed points.
Note: In case, you have selected hours as estimation method in your project settings, you will be shown hours statistics here, instead of Story Points.
3. Sprint Manager
Sprint Manager is highly effective when it comes to managing sprint team members. You can track time and effort per each user, on the Sprint.
4. Burndown Graph
The Sprint Burndown graph tracks the work progress and effort remaining in the Sprint. You can use this graph to view the performance of your Sprint team.
In Sprint burndown graph you can view two different burndown graphs.
4.1 User Story Burndown
This graphs is meant for product owners or other managers who are only interested in User Story progress. This burndown represents the ideal amount of work that must be done in order to complete all User Stories in a Sprint.
4.2 Issue & Task Burndown
This graph is meant for Scrum masters or team members who are interested in more granular tracking on Sprint progress work items. Tasks and Issues effort are shown on the following basis.
- Effort Spent
- Effort Remaining
- Effort Estimated
4.3 Interpreting The Burndown Graph
Sprint Burndown chart is used to know the difference in work left versus planned work of the Sprint. A smooth drop of red line along time, on the graph, shows continuous progress of Done work items.
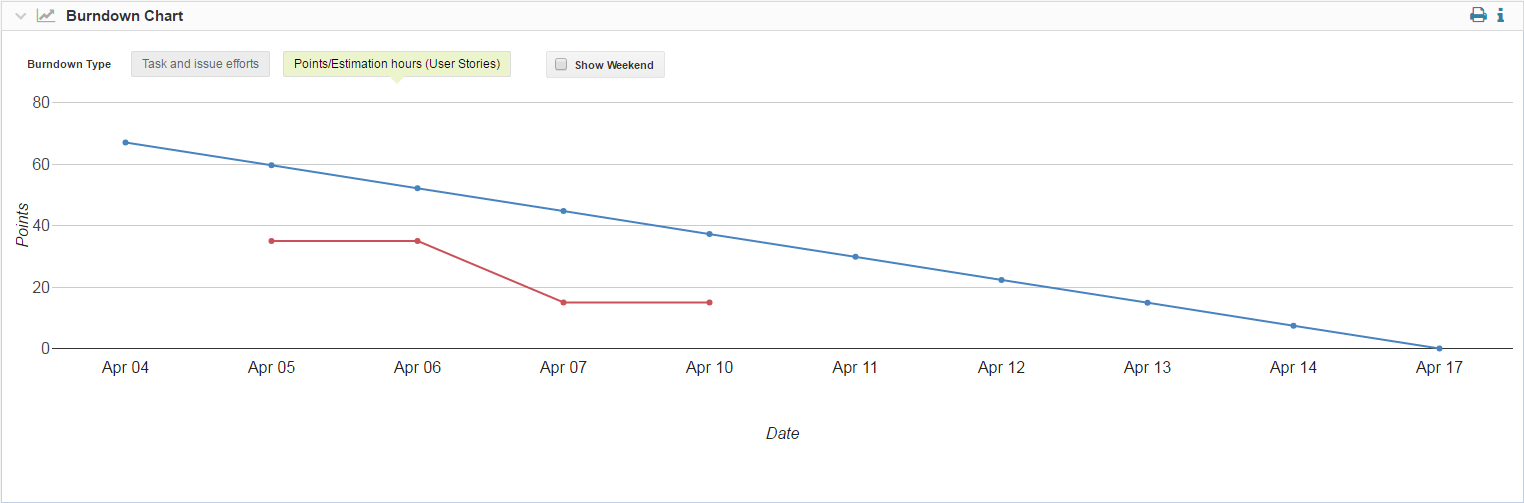
Note: The leftmost corner of graph shows the planned work at start date of sprint. The rightmost side of the graph is the closing date of the sprint. All planned work is expected to finish by that date.
- X axis (Horizontal line at bottom) displays the working days (Mon-Fri). You can enable “Show Weekend” check box, to include weekends in the graph.
- Y axis (vertical side) displays total Story Points or Hours (according to your project settings)
- Ideal effort as a guideline/projection is indicated by the blue line. This line shows the amount of work completed at a uniform rate and all planned tasks are finished by the end of sprint
- Real progress of effort is indicated by the Red Line. It shows the sum of “Effort Remaining”.
- Each dotted point on the line, is the sum of the work “TO BE COMPETED” on that date.
5. Sprint Velocity Graph
Sprint Velocity graph is your team achievement trend per Sprint. It gives graphical and statistical details of team progress for last few Sprints. By looking at multiple Sprint velocity history, you will get an idea that how much your team would be able to deliver in next Sprint.
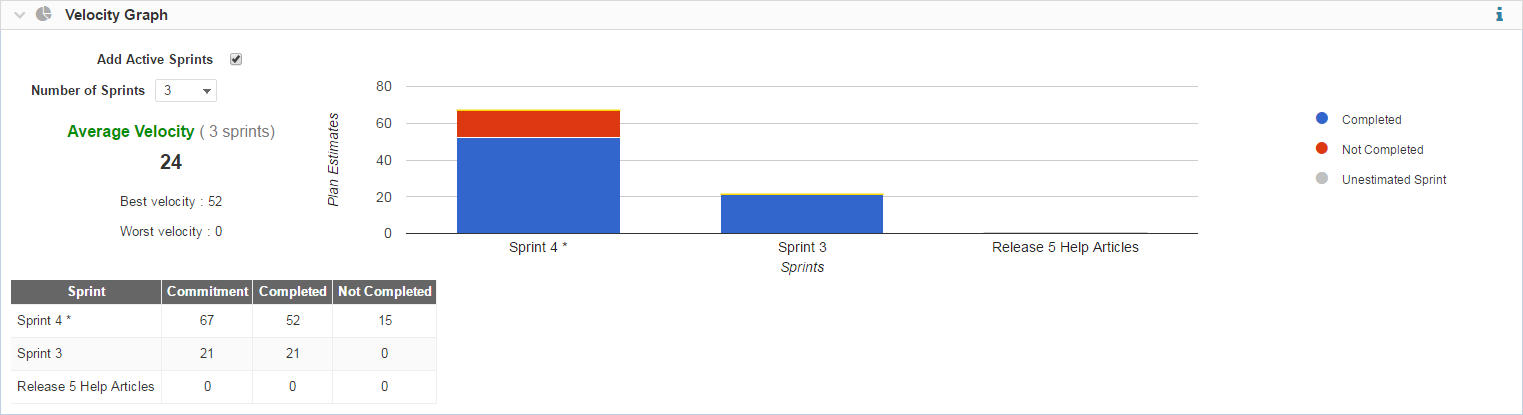
Note: Timeline of X-axis shows the latest sprint at the left most corner of the graph.
5.1 Interpreting The Sprint Velocity Graph
- The Y-axis of the graph shows you Story Points or hours, depending on your project settings.
- The X-axis of the graph shows Date, indicating previous Sprint names. Timeline shows the latest sprint at the left most corner of the graph.
- Blue color shows the Completed work points
- Red color shows Not Completed work points
- The values for Best velocity and Worst velocity reflect the best and worst achieved velocities over selected number of Sprints.
Note: You can view average velocities of up to 10 last Sprint by selecting the Sprints from Number of Sprints dropdown.
6. Sprint Goal
It is the editable field where you can add a list of goals to be achieved by the end of Sprint.
7. Definition of Done
It is the list of criterias (basically a checklist) which must be fulfilled when closing the Sprint. Each team defines their own Definition of Done, according to their needs. At the end of the sprint, this definition is used as a reference to make sure that work is completed accordingly.
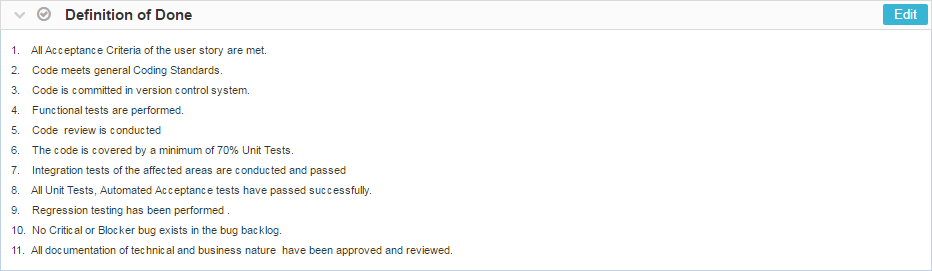
It is very helpful for teams to keep such a list so, they can check if all the defined criteria are met when work is done. If the work was done is justifying the outlines provided in definition of done, you can safely close the Sprint and mark it as done.
8. Attachments
Reference documents for the Sprints are added as attachments which can be viewed in the Sprint Analytics too.
9. Edit Sprint
To make changes in the Sprint information For example, Sprint Name, Description or Dependencies, click on the top right Edit Sprint button.