“Issues in Sprint by Special Tag” graph provides you an overall picture of selected Sprint by splitting User Story associated Issues with special tags.
You can add a tag to identify any work item quickly and visually. A Special Tag can be used as a defining component, feature set, customer or geographical location of the team.
By looking at this graph, you will be able to know selected Sprint statistics as:
- Number of issues in each user story
- Number of issues for each geographical team (special tag)
Note: Only an Admin can create Special Tags
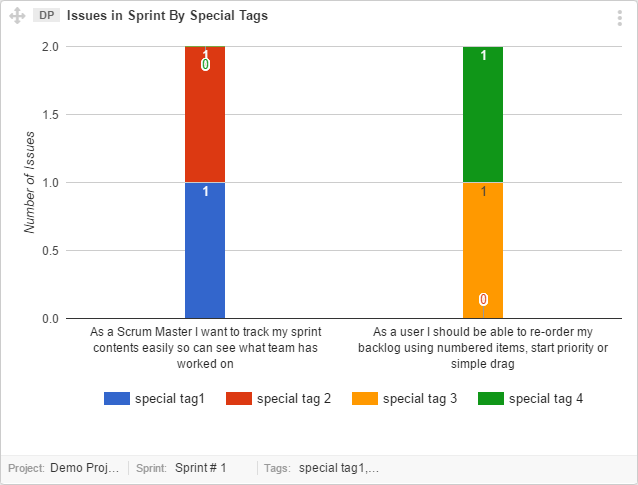
Interpret this graph
- Each bar in x-axis represents one User Story.
- Inside each User Story bar, you can see its associated Issues.
- User Story associated Issues are further categorized by Special Tag.
Monitor Progress of Sprint
You can monitor progress of your Sprint by looking at this widget.
- Determine bottleneck of the Sprint progress by looking at which User Story has the highest number of associated Issues. You may consider dividing the User Story if it is covering a complex scenario.
- If one particular Special Tag count is high, you may need to dig the underlying problem by contacting the Responsible.