The Cumulative Flow Diagram(CFD) is fundamental tool to visualize project progress and helps to spot potential problems. By using CFD, you can track status of work items for a defined period of time. Usually, a steep rise or drop in a graph indicates that there is a problem.
Agile teams get benefit from it, by analysing the problem before it becomes bottleneck of the project success.
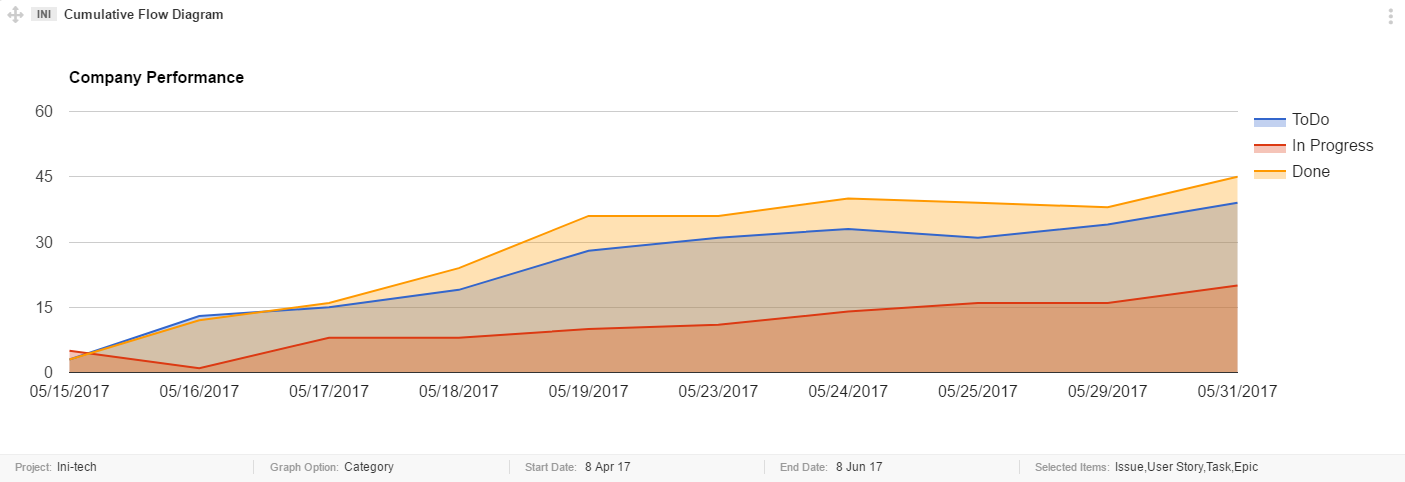
By looking at the chart, you can instantly tell that Project: All Teams progress has been quite good as Orange line indicates that how many items are Done but the Blue Line is also increasing steadily with time, which indicates that Project contents are not finalized and constant increase of ToDo items is the problem to finish this project. Another important factor to consider is Team velocity by checking, how many items are In Progress as compared to newly added ones.
Learn more about how to use the Cumulative Flow Diagram