This graph provides summary of User Stories by status. You can use this graph for evaluating the progress of User Stories. This graph shows you the number of User Stories created in the specified time period and their current status.
This graph can help you in following ways:
- Evaluate User Stories created in a specific time period
- Analyse pace of your team to get User Stories done
- Visualise progress of User Stories associated with selected epic(s)
- Keep track of User Stories status in particular Sprint/Release
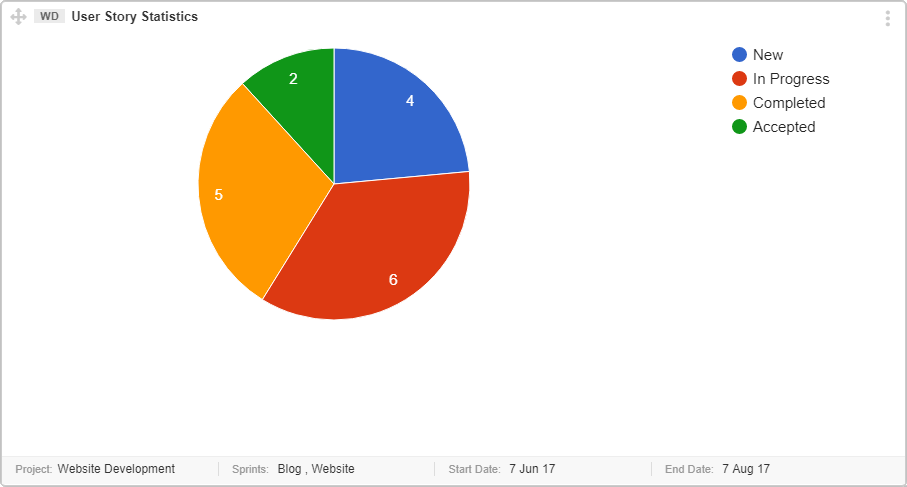
Interpret this Graph
Follow the points below to understand the interpretation of this graph.
- The color coded statuses are provided at the top right of the graph.
- The counts of Items associated with a particular status are provided on the respective colored section of the graph.
Prerequisite for this Graph
- Assign User Stories to a Sprint or Release to get them fixed in targeted timeframe. It can be done in Sprint Planning or Release Planning meeting.
- Decide Your Query – To create a useful User Stories statistics graph, input your queries properly. Graph fields help you create a more specific query. Selecting multiple criteria will be added as AND operator in the query.
User Stories created in a project “All team” in last 3 months
AND they are part of Sprint: “Up Coming Campaign”
AND part of specific Epic: “Epic-177”
AND User Story Status is among (New, “In Progress”, Resolved, Closed, Reopened)
AND Start Date 01.05.2017
AND End Date 31.07.2017
Important points
- All status are listed in the graph field “status”. Check your Project Status set scheme to make sure if you are tracking all correct status.
- Consider following important points while creating the graph.
- Only one project can be selected at a time.
- You can select multiple Releases, Sprints and Issue Statuses while generating this graph.
- Start/End Date – Recent User Stories, that are created within selected duration e.g., last 3 months, where
- Start Date – Issue creation date
- End Date – last date to collect data. e.g., Today