The Sprint Burndown graph tracks the work progress and effort remaining in the Sprint. You can use this graph to view the performance of your Sprint team.
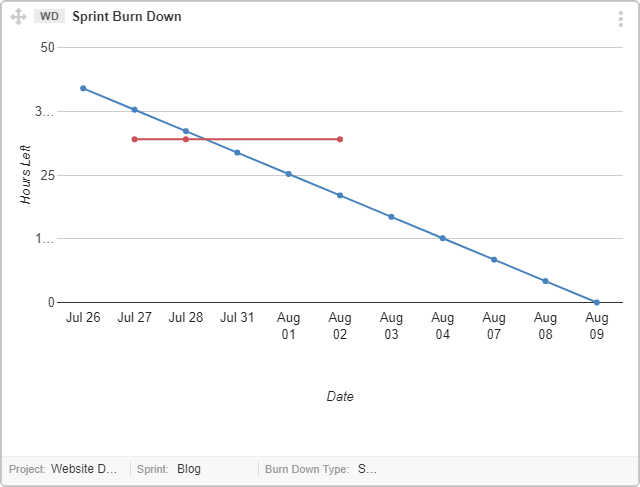
A User Story Burndown graph, where estimation method is “Hours”
In Sprint burndown graph you can view two different types of burndown graphs.
a) User Story Burndown
This graphs is meant for product owners or other managers who are only interested in User Story progress. This burndown represents the ideal amount of work that must be done in order to complete all User Stories in a Sprint.
b) Issue & Task Burndown
This graph is meant for Scrum masters or team members who are interested in more granular tracking on Sprint progress work items. Tasks and Issues effort is shown on following basis.
- Effort Spent
- Effort Remaining
- Effort Estimated
Interpreting the Burndown Graph
Sprint Burndown chart is used to know difference in work left versus planned work of the Sprint. A smooth drop of red line along time, on the graph shows continuous progress of Done work items.
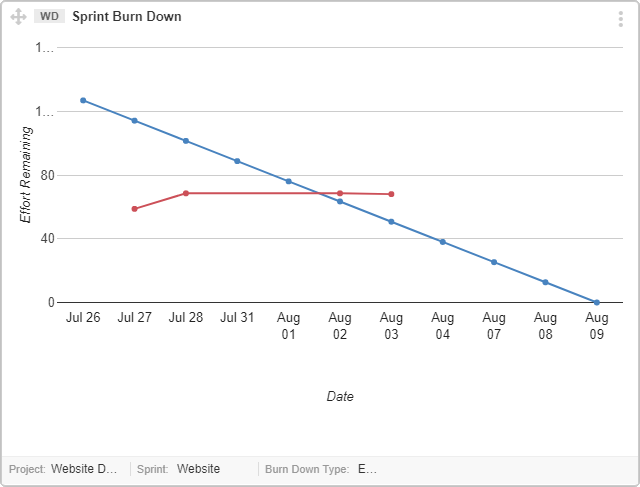
An Issue and Task Burndown chart
Note: The leftmost corner of graph shows the planned work at start date of sprint. The rightmost side of the graph is the closing date of the sprint. All planned work is expected to finish by that date.
- X axis (Horizontal line at bottom) displays the working days (Mon-Fri). You can enable Show Weekend check box, to include weekends in the graph.
- Y axis (vertical side) displays total Story Points or Hours (according to your project settings)
- Ideal effort as a guideline/projection is indicated by the blue line. This line shows the amount of work completed at a uniform rate and all planned tasks are finished by the end of sprint
- Real progress of effort is indicated by the red line. It shows the sum of “Effort Remaining”.
- Each dotted point on the line, is the sum of the work “to be completed” on that date.
Note: Red Dot appears only when there is a “change in User Story Points” or a User Story status is changed to “Done”. If there is no such change in the sprint for a few days, then no progress is shown on the graph. The next change of making a “Done” User Story will show a dot on the specific date by skipping dots for the days lying in between.