Release progress graph helps you evaluate the progress of your Releases in one or multiple projects. By looking at the graph, you can review how much work is left to deliver a release. The items in Releases are shown according to their basic assigned status(Todo, In Progress, Done).
Note: You can view statistics of a project, only if you are a member of that project.
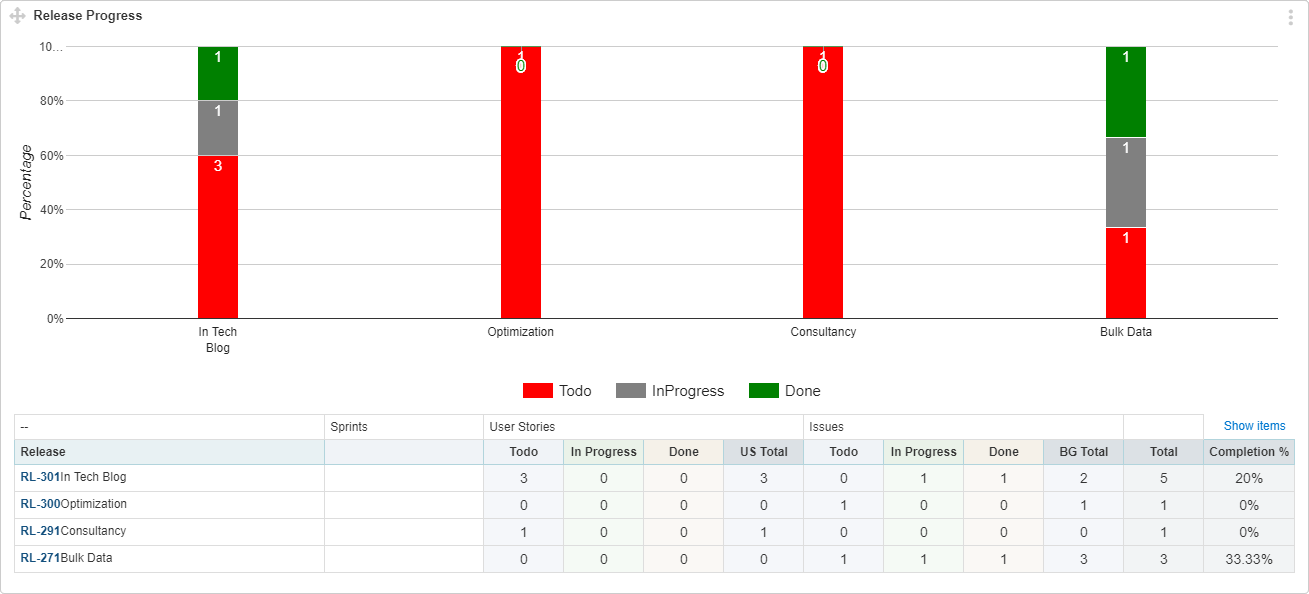
Interpret this Graph
The interpretation of this graph is given below:
- The X axis shows number of Releases as bars.
- The Y axis shows the completion percentage.
- The colors on bars show the Item status.
- Item counter per status is sum of total number of User Story and Issue in particular status
- Detailed stats of Release vs Status only appears below the graph, if you enable “table” option in widget settings.
- Clicking on “Show Items” will list individual items under each status.
- Release start and end date do not have any relation with the widget start and end date. Instead Release Progress graph “Start Date” will count only those items, where item creation date is not before Start Date.
- “End Date” is the date by which stats are calculated.
Benefits of Release Progress Graph:
If you are not sure, how and when to use this graph? To get the benefit of this widget fully, you need to define your needs first and plan your Sprints and Releases accordingly. Selecting different parameters values will help you visualize progress at multiple levels.
i) For Single Project ReleasesSelect single project in the widget settings to get:
- Summary of items (User Story and Issue) per release
- A release burn down graph that shows how much Release work still remains
Select the Release and Sprint in widget settings, where Sprint contents are part of the selected Release and you can:
- Analyze Burn-down of a Release per Sprint
- Assessing amount of work remained for a Release at the start of each Sprint
- Evaluating the number of Release contents (User Story and Issues) in previous Sprints
Select multiple projects and their respective Releases to analyze various projects/teams velocity per Release.
Actions Required From You
To track progress with the Release progress graph, make sure if you are performing these:
- Plan and assign items to the desired Release and Sprint. Only then you can fetch Release analytical statistics.
- Keep all item status updated. Old information will not lead to conclude a realistic situation.
- Make sure that all Release contents are part of the widget data by checking the oldest item creation date in your Release. Keep it as “Start Date” in widget settings.