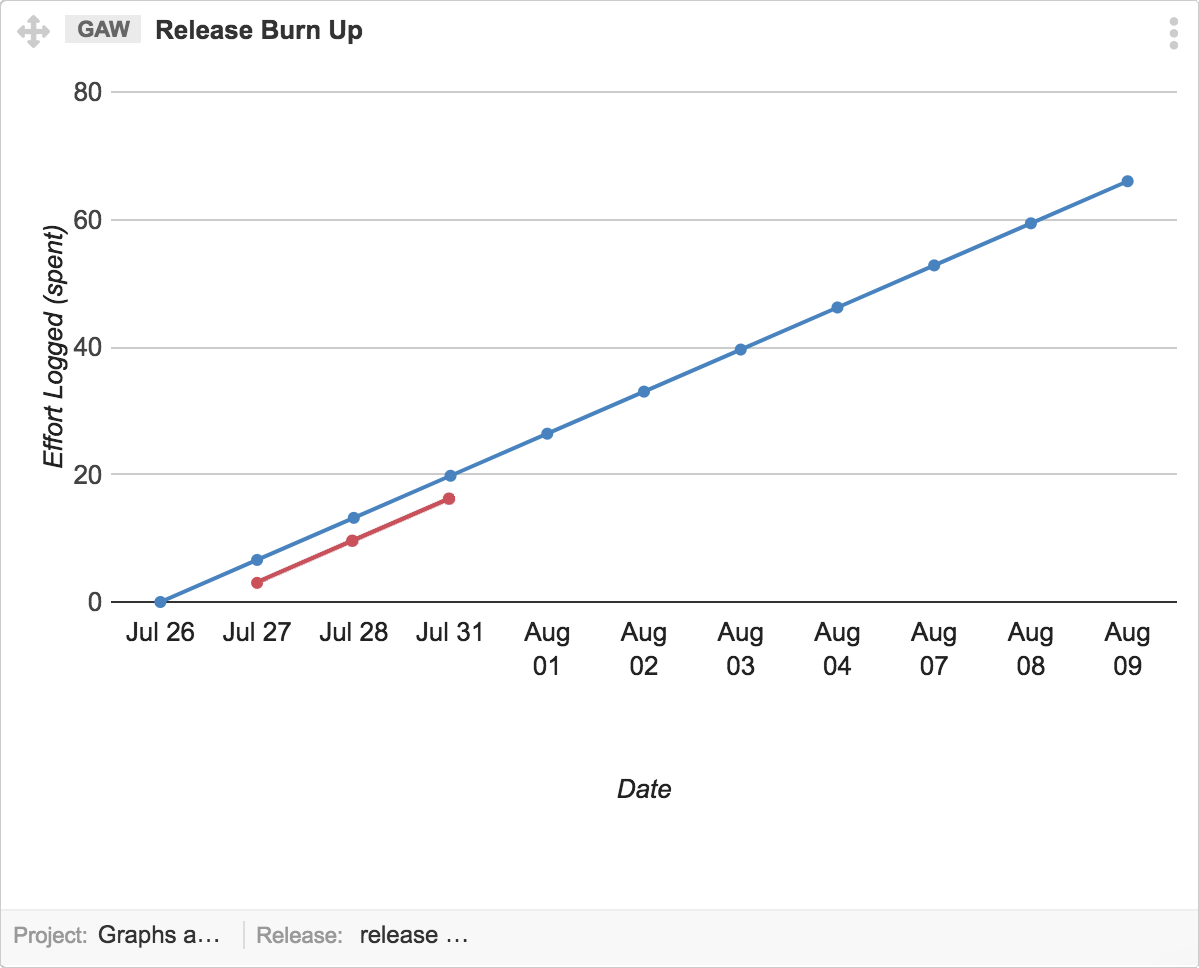
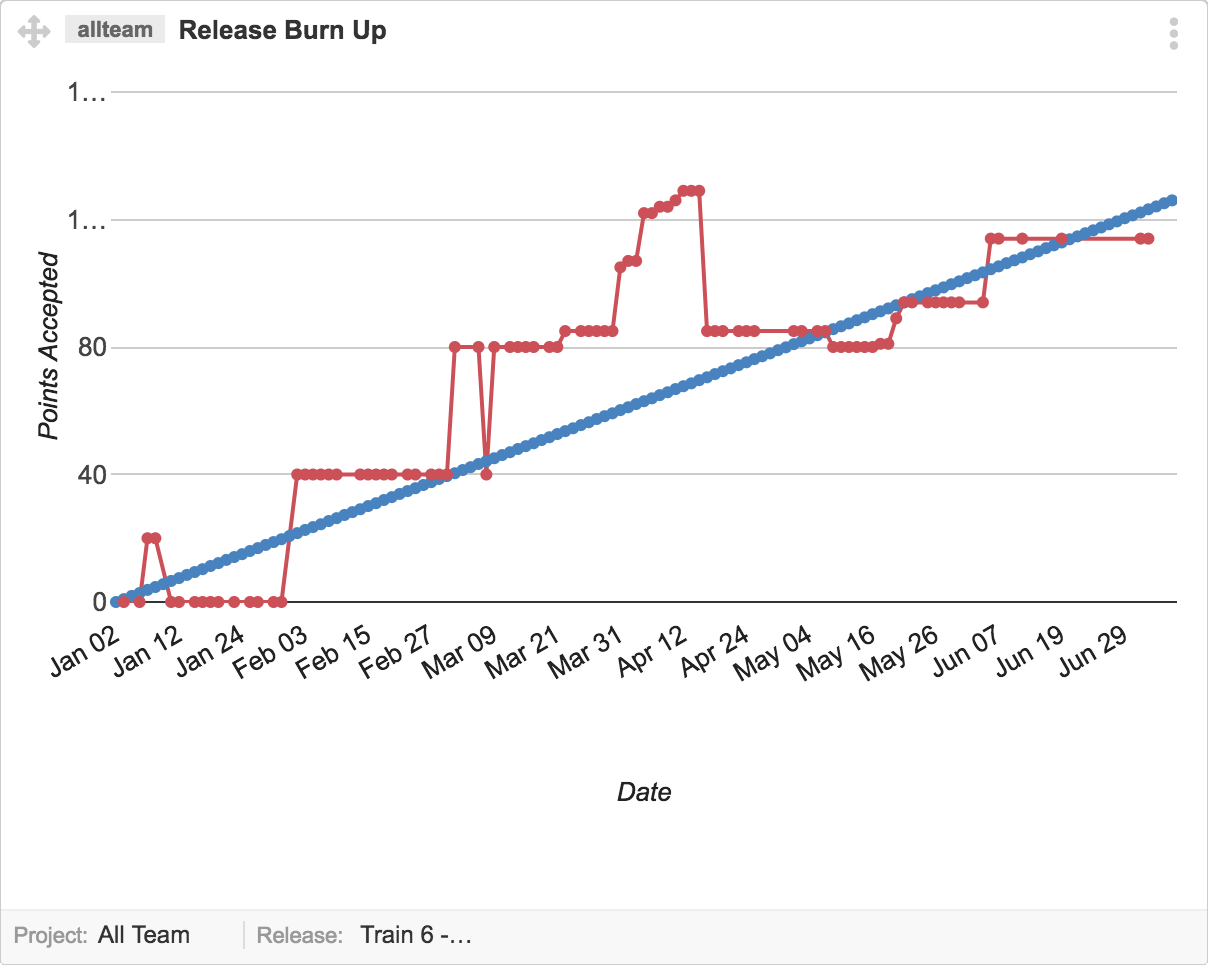
This graph shows you the progress of a Release by comparing planned vs completed work. It tracks how much work team has completed over a period of time. Work could be User Story points or spent hours, depending on your project settings.
Interpret this graph
Release Burnup chart is used to know the difference in work completed versus planned work of a Release. A smooth rise of the red line along time, on the graph, shows the continuous progress of Done work items. The distance between two lines on the same date is the amount of work estimated vs finished by that date. The Release estimated work will be complete when both ends meet their ends.
- X axis displays the working days as date.
- Y axis represents “Completed Story Points” or “Spent Effort in Hours”. Values depend on your project estimation settings.
- Ideal effort as a guideline/projection is indicated by the blue line. This line indicates the required progress pace to finish all planned work at a uniform rate by the end of Release date.
- Real progress of effort is indicated by the Red Line. It shows the the sum of “Effort Spent”.
Note: The leftmost corner of graph shows the planned work at start date of Release. The rightmost side of the graph is the closing date of Release. All planned work is expected to finish by that date.
Prerequisites for this graph
Make sure that all user stories have an initial estimate before start working on the Release. If a User Story does not have any estimation value, it will not be considered in graph statistics and graphs will not show the real picture of your project.
Important Notes
- A Completed/Done User Story only appears as “completed work” when the status of user story changes under status set “Done” category. Check your Release board status set settings via board layout editor.
- Release status (Planning, Active, Accepted) does not impact on the graph. You can check your release status by following the navigation below:
A Project where Estimation Setting is “Hours”. Y-axis will show planned effort number as spent effort once User Story is complete.