This graph gives you a real time sum of Open Issues, including a one-month lowest and highest amount of bugs. Issues under status set; “new” and “in progress” are considered as Open. With the help of this graph, you do not need to check your project status set scheme to know its total amount of Open issues.
Note: Access to Project status set scheme needs admin rights, contact your admin for details.
Interpret This Graph
Follow the points below to understand interpretation of this graph.
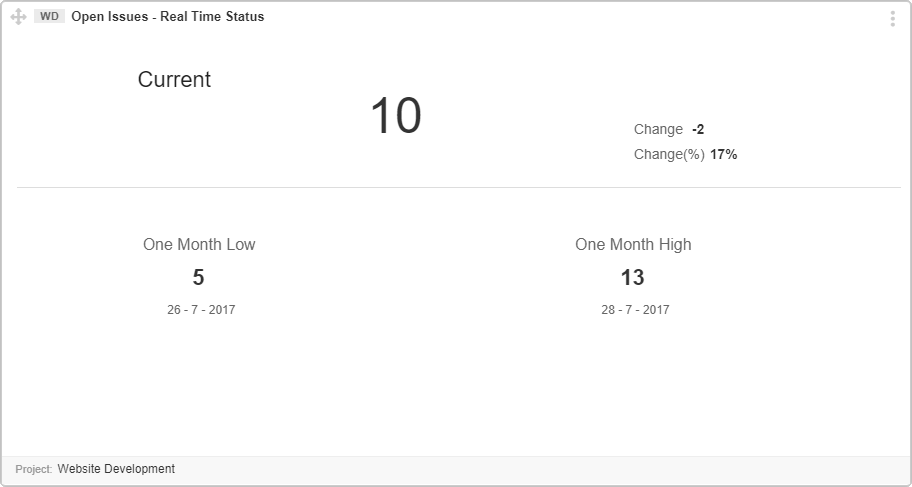
- The “Current” represents the number of currently open Issues in your project.
- Change represents the difference between yesterday’s and today’s Issues.
- Change % represents the percentage of change between yesterday’s and today’s Issues.
- “One Month Low” denotes the lowest number of open Issues in a month.
- “One Month High” is the highest number of open Issues on a specific day of the month.
- A month here is considered as current date to last 30 days