This graph helps you to catch on to the number of current unresolved Issues in a project. These Open Issues are the ones which are New or Not Completed/Closed. In one Open Issue graph, you can get statistics of multiple sprints and releases of a Project.
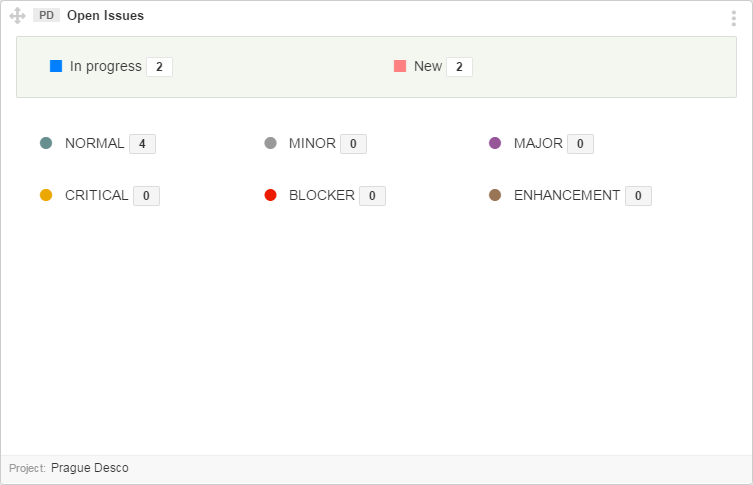
First bar of chart shows sum of issues in 2 categories: New and In Progress.
For Detail analysis, it also sorts the issues in accordance with severity. Issue Status with colored icon helps to indicate the severity of the issue. Counter beside each status is sum of issues of that status.