This graph gives you an overview of total Issues per User Story in a Sprint. It unveils severity of those Issues as well.
Handling Issues is as important as handling User Stories of a Sprint. You can add an Issue as independent Issue in a Sprint, or you can add an Issue under User Story association in Sprint Board. The progress of such User Story could be dependent on the progress of its Issues. You can use this graph to know the progress of such User Stories and Issues in a glance.
How to Interpret this graph
Interpreting this graph is very easy, please follow the points below in order to understand the interpretation of this graph.
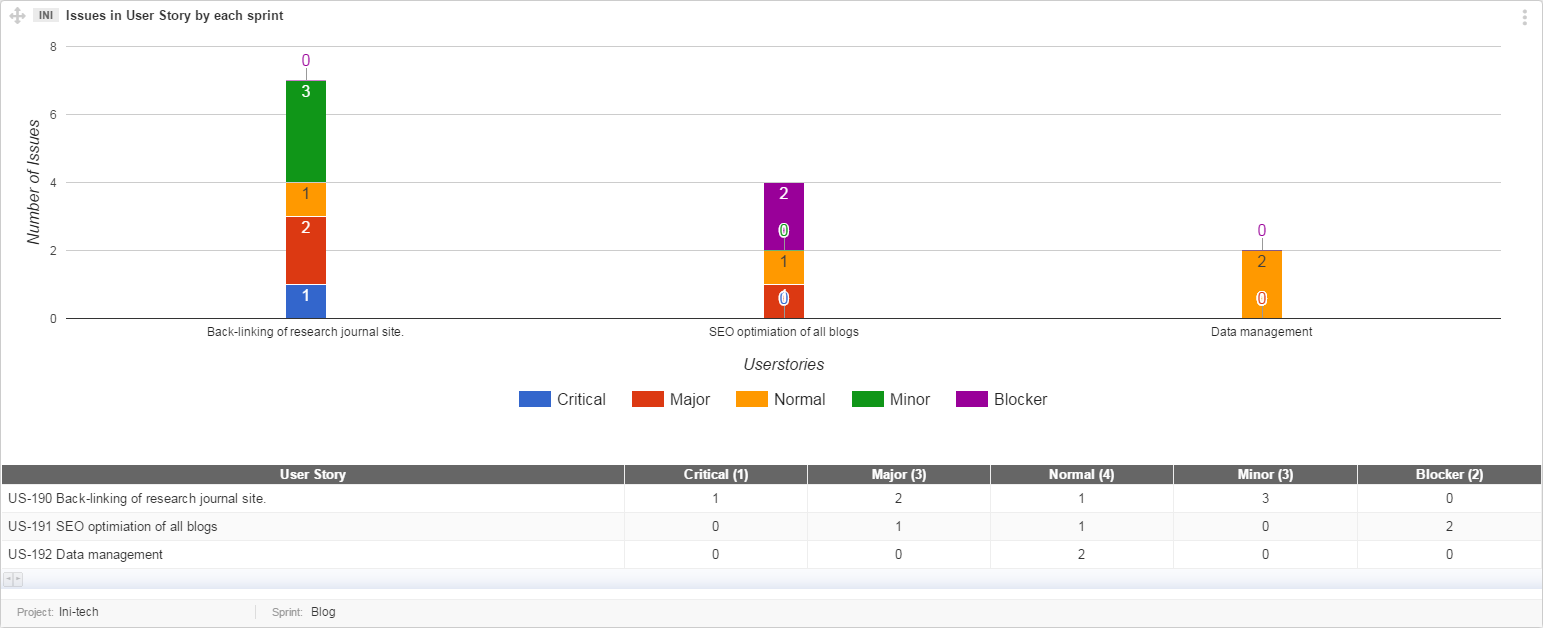
- Each bar in x-axis represent User Story.
- Inside each User Story bar count of Issues is shown.
- Y axis shows the number of Issues.
- Inside each bar is displayed an Issue counter. There could be multiple counters on the bar, depending on the number of statuses shown in graph.
- Each bar has colors to differentiate status. Status with colors is mentioned under the graph. Status Settings are defined in each Project settings.
- In above graph, User Stories are defined as Normal, and Critical. The number shown on each colored bar is the sum of User Stories in that status. In case, if there is no User Story in a specific status then 0 is shown at the top of the bar. The color of that 0 represents the status, it exhibits.