This graph gives you a detailed view of number of Issues assigned to each project user.
Simply put, this graph can help a manager to see how much work load there is on each user. At the same time, you can see status of these issues.
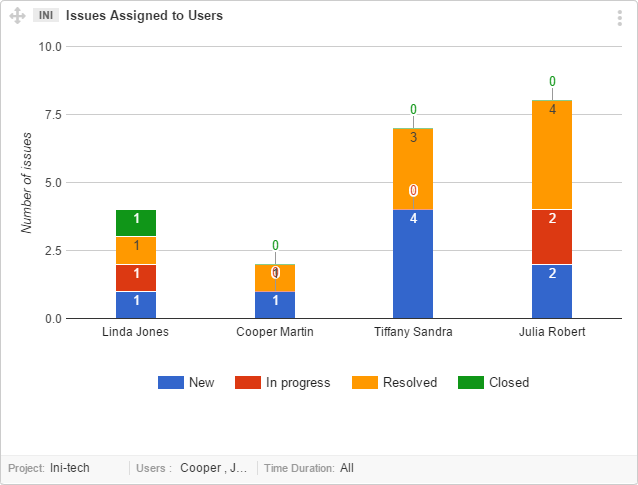
How to Interpret this graph
- The X-axis of the graph shows Responsible Users.
- The Y-axis of the graph shows, Number of Issues.
- Issue count and different colors are to identify number of errors per status
A good way to look at team workload balance is possible through this widget. If one user has too much issues than rest of the team. It indicates that workload should be considered to shift from one responsible to other team members.