The Epic progress graph yields bird’s eye view of all selected Epics advancements. You can select epics for just one project or all epics of your Organisation in one graph. Additionally, by using the pie chart, the manager can deduce the stage of completion of the User Stories contained in each epic.
1. Interpret Epic Progress graph
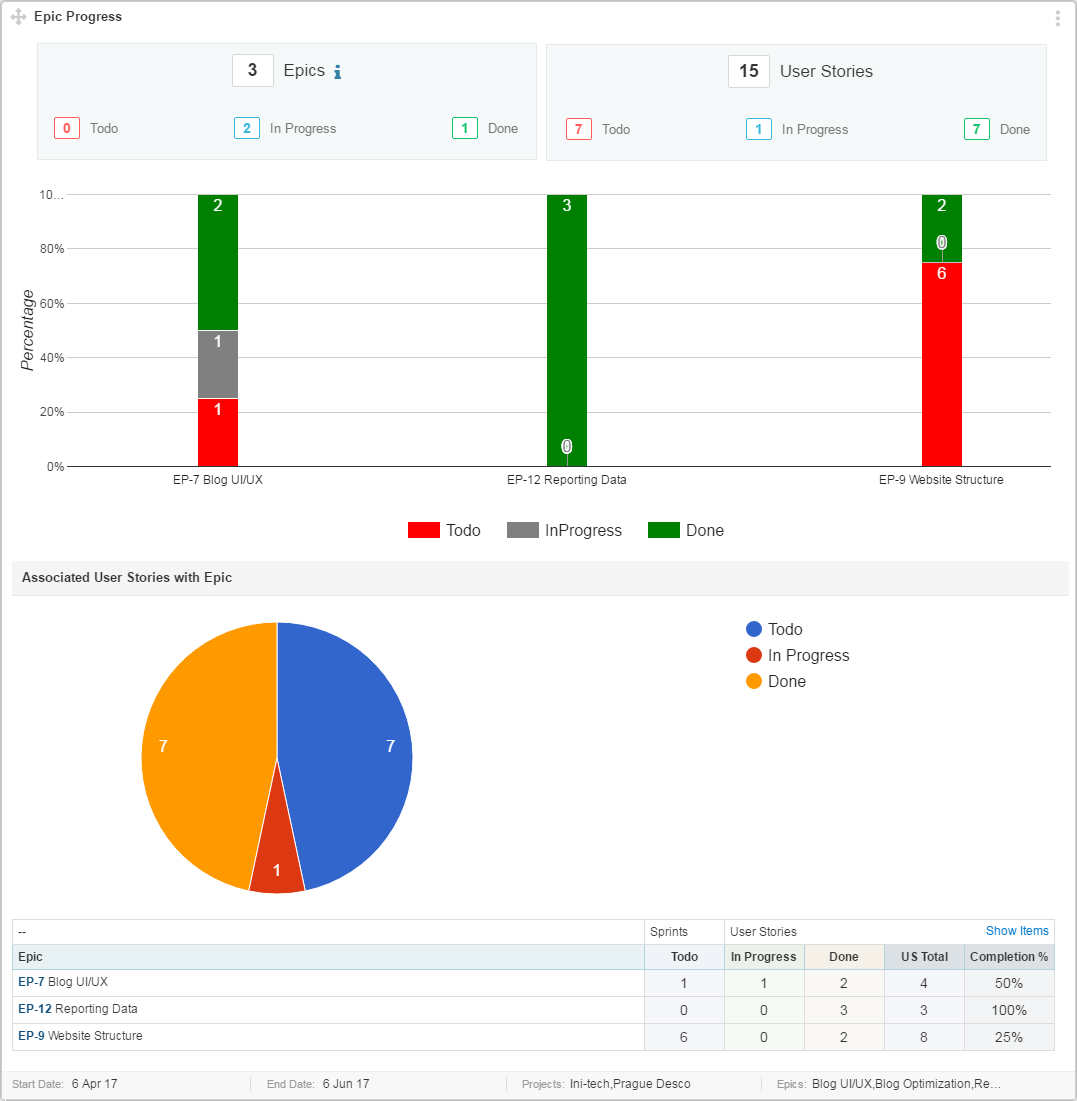
Interpreting Epic Progress Graph is quite easy once you understand all its aspects, Epics Progress graph has 3 parts.
1.1 Epics Progress Summary:
This part focuses on overall Epics progress. It has 3 following sections.
- Epics Summary
- User Stories Summary
- Epics vs Completion percentage
Epics counter shows total number of epics counted in this graph. Note that an epic without any User stories is not counted in this graph.
Total number of User Stories and their status counter is shown.
X-axis: Each Epic is represented by a bar on the graph. Each bar has colors to differentiate status. Status Settings are defined in Project settings.
In above graph, User Stories in the Epic are defined in ToDo, In Progress, and Done categories. Number shown on each colored bar, is sum of User Stories in that status. In case, if there is no User Story in a specific status then 0 is shown at the top of the bar. Color of that 0 is same as color of that status.
Y-axis: You can quickly gauge the percentage of User Stories in each category by looking at the Y-axis.
By looking at EP-171 you can conclude that:
- 30% User Stories are not started yet and in status: To Do
- 50% User Stories are In Progress
- 20% User Stories work is already Done
1.2 Associated User Stories Progress
This part shows you the summary of associated User Stories Progress.
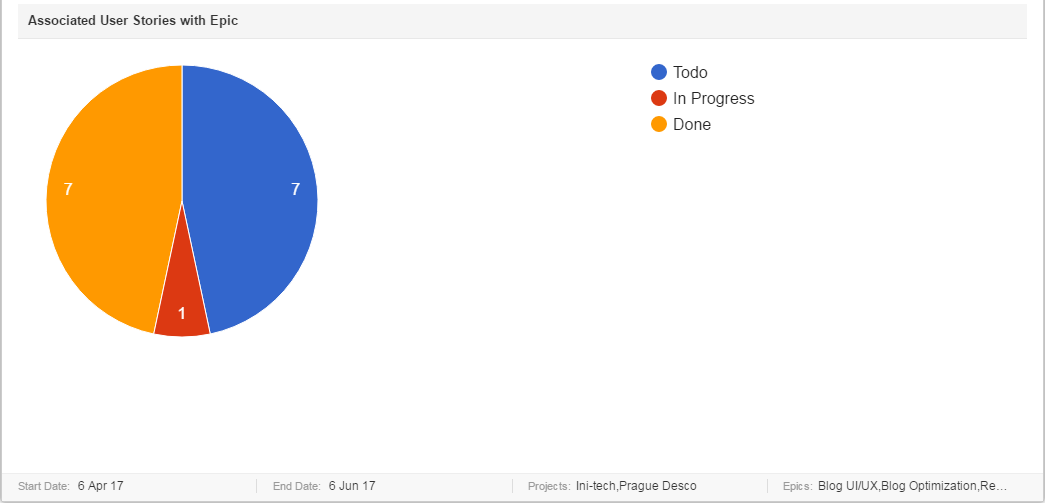
This Pie graph uses colors to describe status and counter on each color shows sum of User Stories in that status. Note that, this graph is useful to know progress of associated User Stories, regardless of their epics.
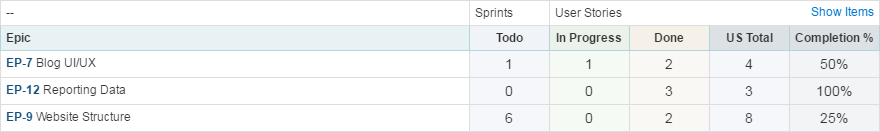
1.3 Statistics Table
This table shows data used to formulate this graph. By default, it is not shown. In order to get this data, mark “Show Table” checkbox, in this widget settings.
Note: “Start/End Date of Epic Progress graph” are important to consider while formulating this graph. Epics are populated accordingly. For example, if an Epic started on 15, Feb and its User Stories are In Progress. If you have set Start Date in this graph as 16 Feb, then this Epic will not be included in this graph.