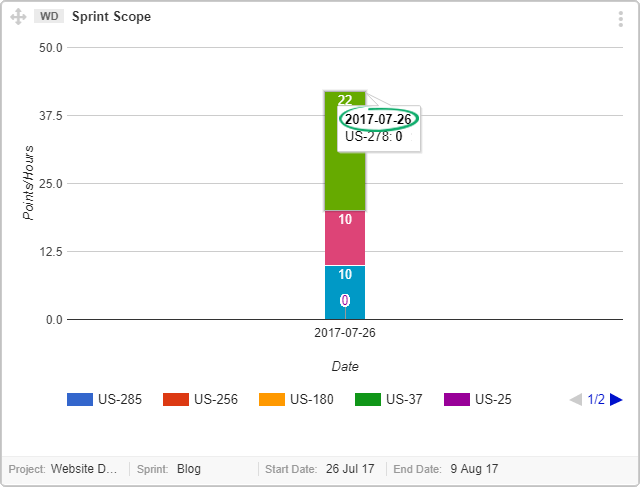
The Change in Sprint Scope Graph shows the User Stories added or removed during the Sprint life cycle. This graph gives a view of scope change during the course of sprint.
Yodiz Sprint Scope Graph helps you to understand what changes have been made even after Sprint already started. You can compare what was the original scope and how much has been changed. It may help you to understand why all work is not complete at the end of Sprint.
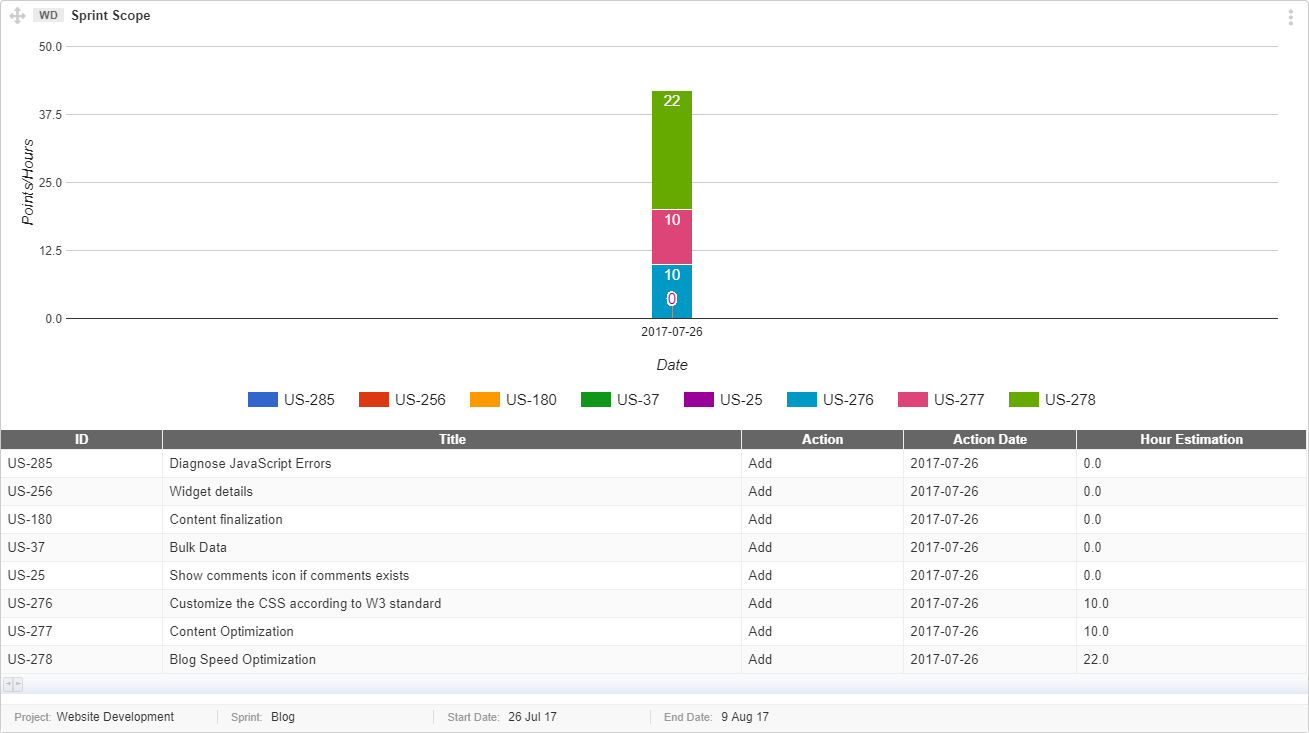
This graph provides you following information:
- List of newly added or removed Items.
- Date of adding an Item to Sprint.
- Effort estimate.
Interpret this graph
Interpretation of this graph is given below:
- X- axis represents the Sprint days, where a change happened.
- Y- axis represents the estimates in Points or Hours, depending on project estimation method.
- Color coded User Stories are provided under the X axis.
- The effort estimates are shown as the bars of User Stories.
- The newly added Items will reflect as bars on the specified date.
Prerequisite for this Graph
Make sure that all User Stories have an initial estimate when adding the User Story.
Important Points
- You can choose any custom start or end date, for e.g you are only interested to know the new work which is added in first five days of Sprint.
- Adding or removing Issues from a Sprint are not shown in Sprint Scope.
- The graph will show the unestimated User Story as a thin line on the specified date, take a look at the screenshot below: