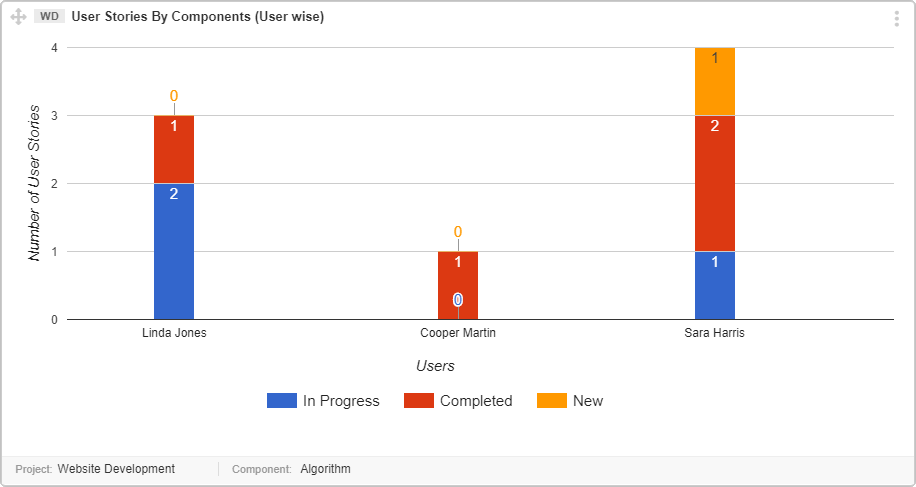
This graph gives you a real time analysis of User Stories in a component, assigned to team members.
It provides you a detailed view of:
- Number of User Stories assigned to each User
- Status of User Stories per User
How to Interpret this graph
- The X-axis of the graph shows User names.
- The Y-axis of the graph shows the number of User stories.
- The User Stories are color coded by status.
Prerequisites for this Graph
Make sure that components are assigned to the Items for generating this graph.