Reporting and tracking is key aspect of management. Managers need to have overall picture of team’s performance, that’s why Yodiz offers the feature of User Dashboard. The Dashboard is a smart feature intended to power users with an overall progress report. The Dashboard allows each individual user to create their own personalized dashboard and a choice to share it.
1. Create New Dashboard
Dashboards are Project specific. You can create multiple dashboards for one project. In order to use Dashboard for creating widgets, you have to create a new Dashboard. Follow the navigation below to create a new Dashboard.
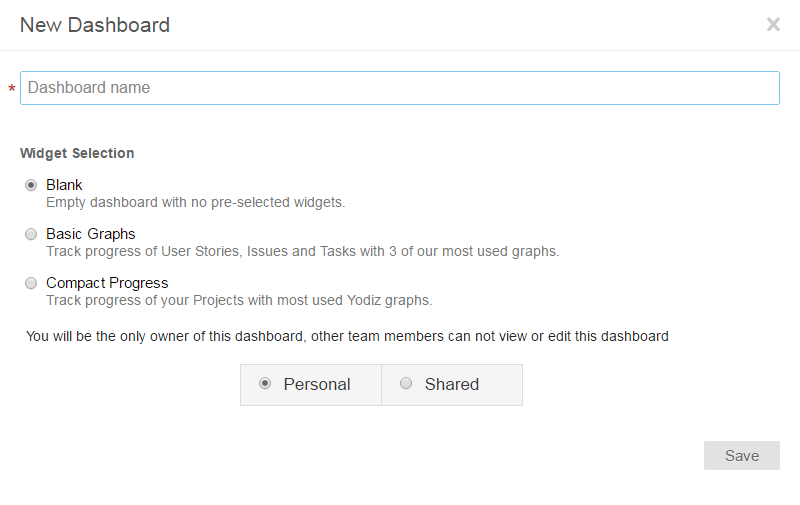
Provide name and check one of the options from widget selection. There are some pre-selected set of graphs under “Basic Graphs” and “Compact Progress” dashboard options.
Related: How can I create a new dashboard if I already have an existing dashboard?
2. Choose Type of Dashboard
There are mainly two types of Dashboards that can be created.
- Personal (My Dashboard)
- Shared
2.1 Personal Dashboard
This dashboard is only visible to the currently logged in user. A Personal Dashboard is each user own dashboard. User is free to add or remove widgets. Project Team members can not access each other personal dashboard.
2.2 Shared Dashboard
This dashboard can be visible to multiple or all Users within the company. Project Managers and Scrum Masters usually create a shared dashboard. Such board helps to make team aware of important factors of Project progress.
Any user can create a Shared Dashboard and define team members who can access it. A shared dashboard can only be edited by its creator. Other team members cannot make any changes in the board.
Add your users and save the changes. You can change dashboard type and permissions at anytime by clicking on icon located at top right corner of dashboard.
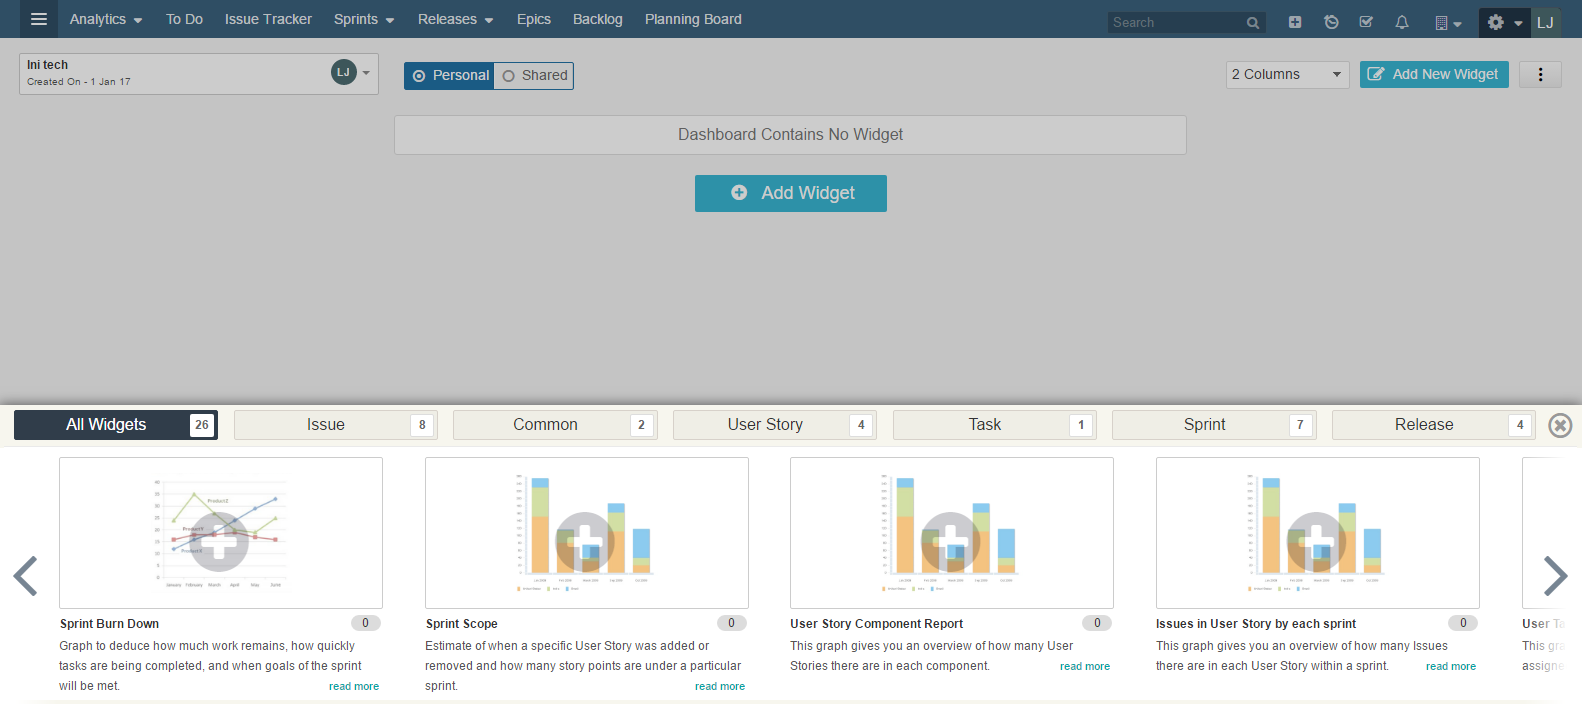
3. Select your Widget
Select graphs and metrics that you want to generate. Click button on right side of dashboard, “Add New Widget”  and select the graph from given list by clicking on Plus Icon (+) provided with each graph. Fill in the details and save your widget/graph.
Note: Your Project Timezone setting is reflected on the graphs and burndown. If your local timezone is different than project time belt then graphs follow project timezone to retrieve and display statistics.
Related: What is Project Time Zone?
3.1 Available widgets
There is a huge library to choose from. Categories are defined for user. Let’s have a look at these below.
| Issue Graphs |
|
|---|---|
| Common Graphs |
|
| User Story Graphs |
|
| Task Graphs |
|
| Sprint Graphs |
|
| Release Graphs |
|
4. Create Widgets with Minimal Effort
In order to create widgets on Dashboard, you need to create a dashboard first. Once you land on your dashboard, you can select from a list of widgets by clicking on Add New Widget button.
5. Design your Dashboard
The dashboard can include graphs and metrics which have been handpicked by the user from a vast collection. In this way you can view and track the key statistics per project that matter to you.
- Use to relocate your graphs on board. You can also define number of widget columns on dashboard.
- Set graph size Large or Small, under each widget settings
- If you are using high resolution screen, there is an additional option to set number (2 or 4) of widgets in one row. To set the limit, use columns dropdown located on top right corner of dashboard.
6. Export Graphs and Statistics
You are able to export your graphs in either .png or .pdf format. It allows you to make printable copies for physical reports. A graph can be exported by clicking on its respective options via Ellipses icon (top right corner of each widget).
7. Edit or Delete a Graph
A graph can be edited, and deleted by clicking on its respective options via Ellipses icon located at top right corner of each widget.
8. Edit or Delete a Dashboard
A dashboard can be edited, and deleted by clicking on its respective options via Ellipses icon located at top right corner of each dashboard. Dashboard owner can change dashboard type as well.