Custom Graph enables you to make a graph of your own choice by selecting specific criteria. You can create a pie or bar graph for the same criteria. This graph will show your selection in different colors and a numeric value to depict sum of each attribute. You can select any of your Project, any Item type, related item attributes, and respective attribute values. Date range can also be selected to fetch data for specific period of time.
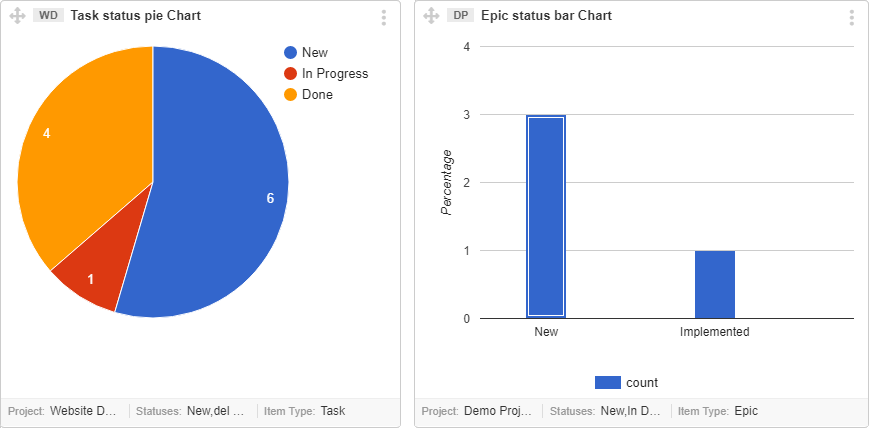
Example graphs to depict “All Tasks status in pie” and “Epics status in bar” chart
Generate Custom Chart
To generate a custom graph in a dashboard, follow the navigation below:
Custom Graph Fields
Use these fields while defining a custom graph where Project, Item Type, Attribute, and Graph type are mandatory fields to fill a value.
| Graph Fields | Description |
|---|---|
| Graph Name | You can enter graph name of your choice. If user keeps it empty then graph name will be auto generated according to the selection of your graph attributes. |
| Project | Click on Select Project option and choose the desired project from dropdown. Only one project can be selected at a time. |
| Item type | Custom Graph can be made for Issue, User Story, Epic and Task. |
| Attribute | From the dropdown of this field, click on the specific Attribute you want Custom Graph for. Attribute values vary according to the item type selected. |
| Graph Type | Supported types are: Pie Graph and Bar Graph. |
| Item Attribute Type Values | Attribute type values are fetched from your project, depending on your item type and main attribute selection. |
| Graph Size | Graph size will determine its appearance on your dashboard. |
| Show Date Range | Check this option if you want a graph to fetch data for specific time period. Leaving this field empty will set default date range of the graph, i,e., from project “start date” to “current date”. |
Decide your criteria
To create a useful graph, input your criteria properly. Graph fields help you provide a more specific criteria. Selecting multiple criteria will be added as AND operator in the query.
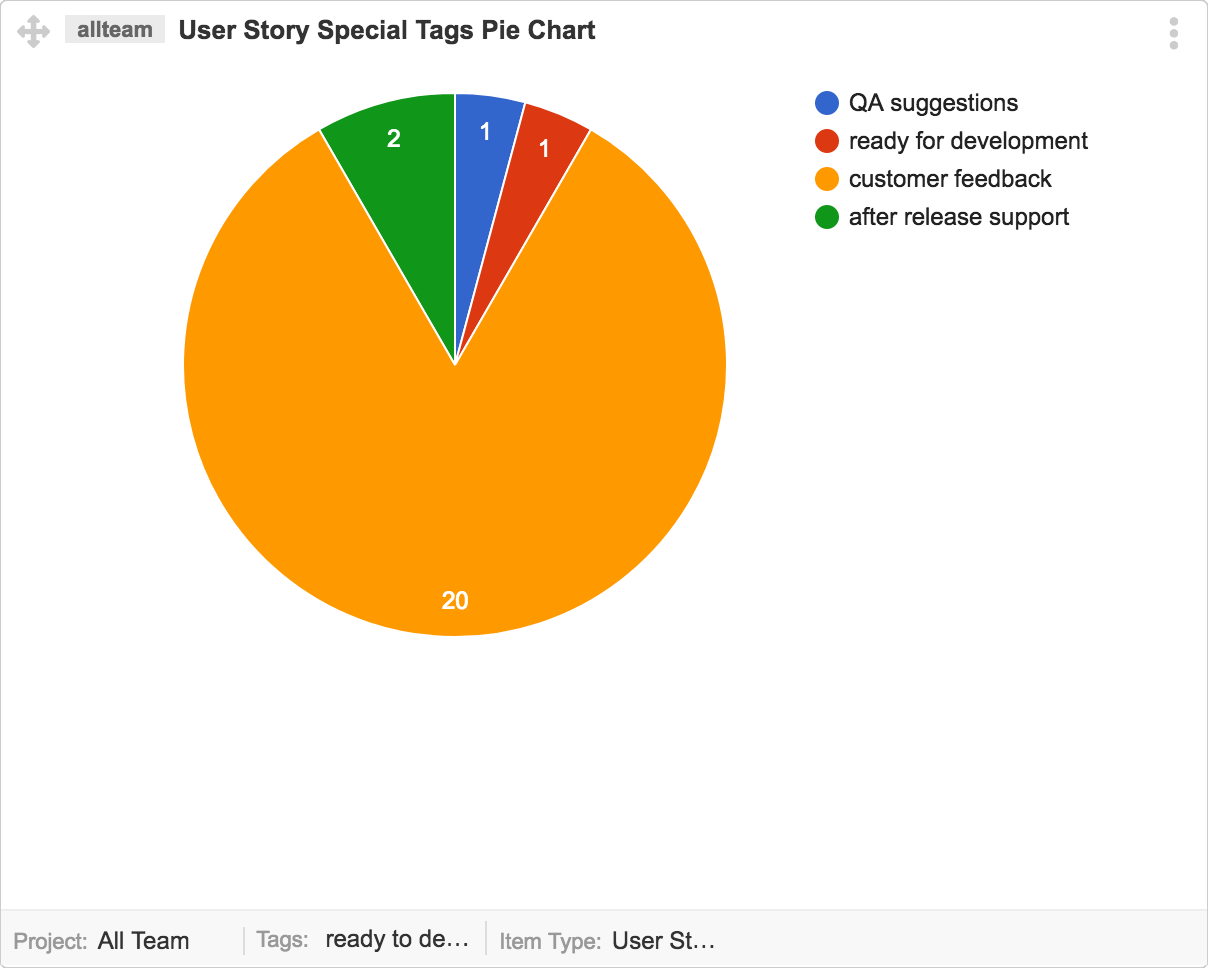
A Custom Graph Example
Let’s create an example Custom Graph; “User Story Special Tags Pie Chart”.
If you want to create a pie chart to show the number of User Stories with Special Tag values.You want to fetch this information without any date limit i.e. collect data since the project was created till today.
Your selection criteria look like:
Select Project “All team”
AND Item type is User Stories
AND Graph type is Pie chart
AND collect data for user story attribute “special tags”
AND select only special tags values (“customer feedback”, “QA suggestions”,…)
Related: Dashboard Graphs Faqs